|
Discovery
8 Channels |
Discovery
8 Channels |
Discovery Pro
16 Channels |
Discovery Pro
64 Channels |
Discovery Pro
16/64 with Optional VideoBench |
| Price |
$5,950 |
$6,450 |
$7,950 |
$9,950 |
Additional $3,950 |
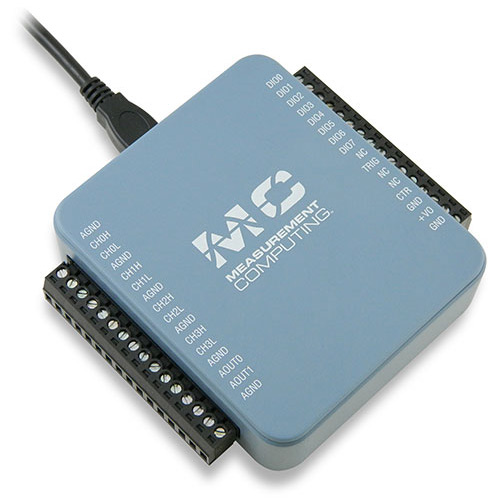
| Data Acquisition (Analog and Digital Input) |
| Enclosure Type |
Screw Terminal |
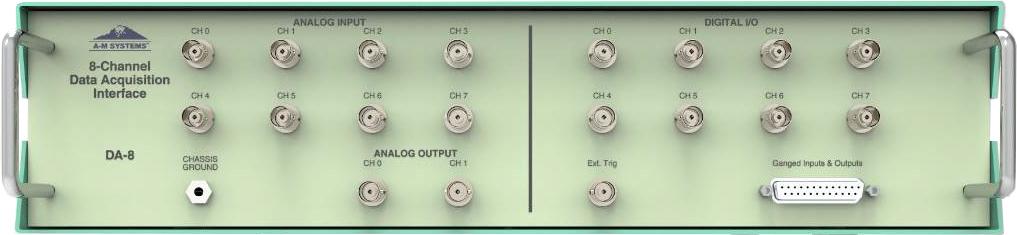
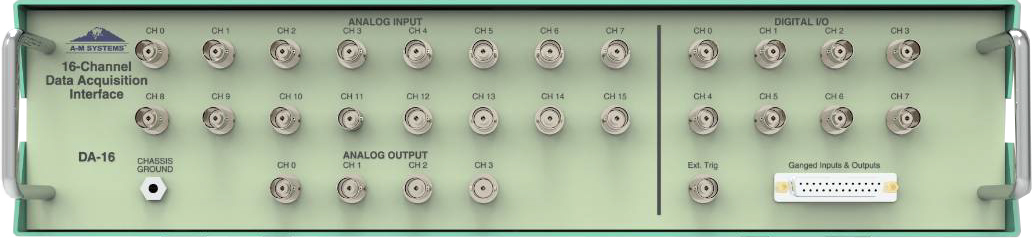
Rack Mount BNC Breakout Box |
Rack Mount BNC Breakout Box |
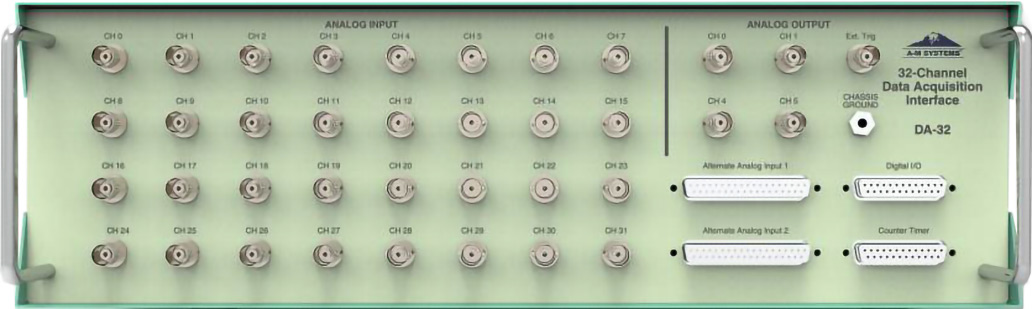
Rack Mount BNC Breakout Box |
Rack Mount BNC Breakout Box |
| Single Ended Analog Input Channels |
8 |
8 |
16 |
16 or 64 |
16 or 64 |
| Differential Analog Input Channels |
4 |
4 |
8 |
8 or 32 |
8 or 32 |
| Independent sampling rate and A/D gain settings per channel. |
|
|
|
|
|
| Maximum Sampling Rate per channel |
100 kS/s |
100 kS/s |
1 MS/s |
1 MS/s |
1 MS/s |
| Resolution |
16 bit |
16 bit |
16 bit |
16 bit |
16 bit |
| Sensititivty |
± 10 V |
± 10 V |
Seven ranges of sensitivity, from ± 100 mV to ± 10 V |
| Record both acquired and analyzed data to disk for off-line processing |
|
|
|
|
|
| All data items are timestamped to 1 microsecond resolution for experiments lasting hours, days, weeks with a high resolution clock |
|
|
|
|
|
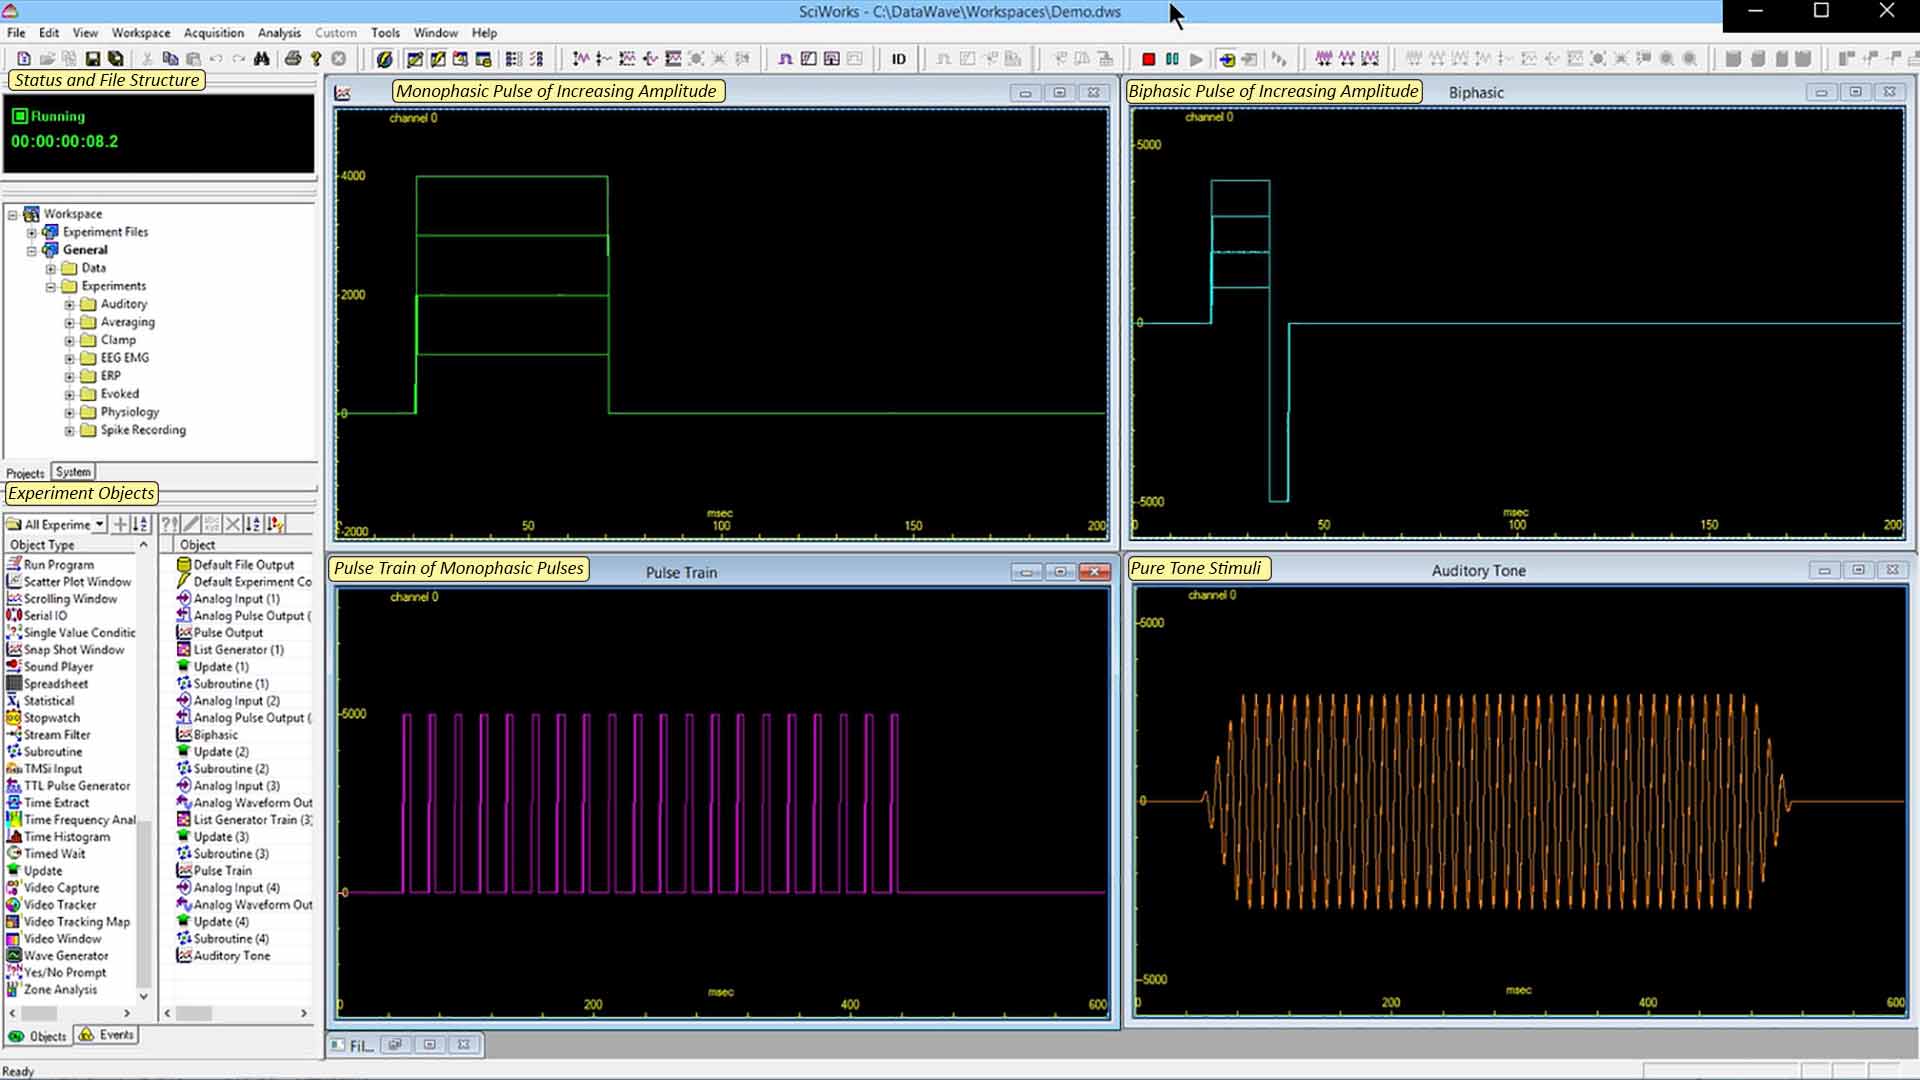
| Stimulus Generation and Analog/Digital Output |
| Generate stimuli and acquire data at the same time |
Standard Stimulus Set |
Standard Stimulus Set |
Complex stimuli, including audio |
| A stimulus "List Generator" automates stimulus output and provides both random, pseudo-random and fixed output |
|
|
|
|
|
| Generate analog waveform output for auditory or behavioral queuing. |
|
|
|
|
|
| Play and manipulate .wav files for auditory stimulation |
|
|
|
|
|
| Programmable counter/timers interface for complex pulses or pulse trains |
|
|
|
|
|
| Analog Output |
| Channels |
2 |
2 |
4 |
4 |
4 |
| 16 Bit Resolution |
16-bit |
16-bit |
16-bit |
16-bit |
16-bit |
| Speed |
5 kS/s |
5 kS/s |
1 MS/s aggregate |
1 MS/s aggregate |
1 MS/s aggregate |
| Digital Input / Output |
| Channels |
8 |
8 |
24 |
24 |
24 |
| Counters |
0 |
0 |
4 |
4 |
4 |
| Timers |
0 |
0 |
2 |
2 |
2 |
| Counter/Timer |
1 |
1 |
0 |
0 |
0 |
| Experimental Control, Execution and Timing |
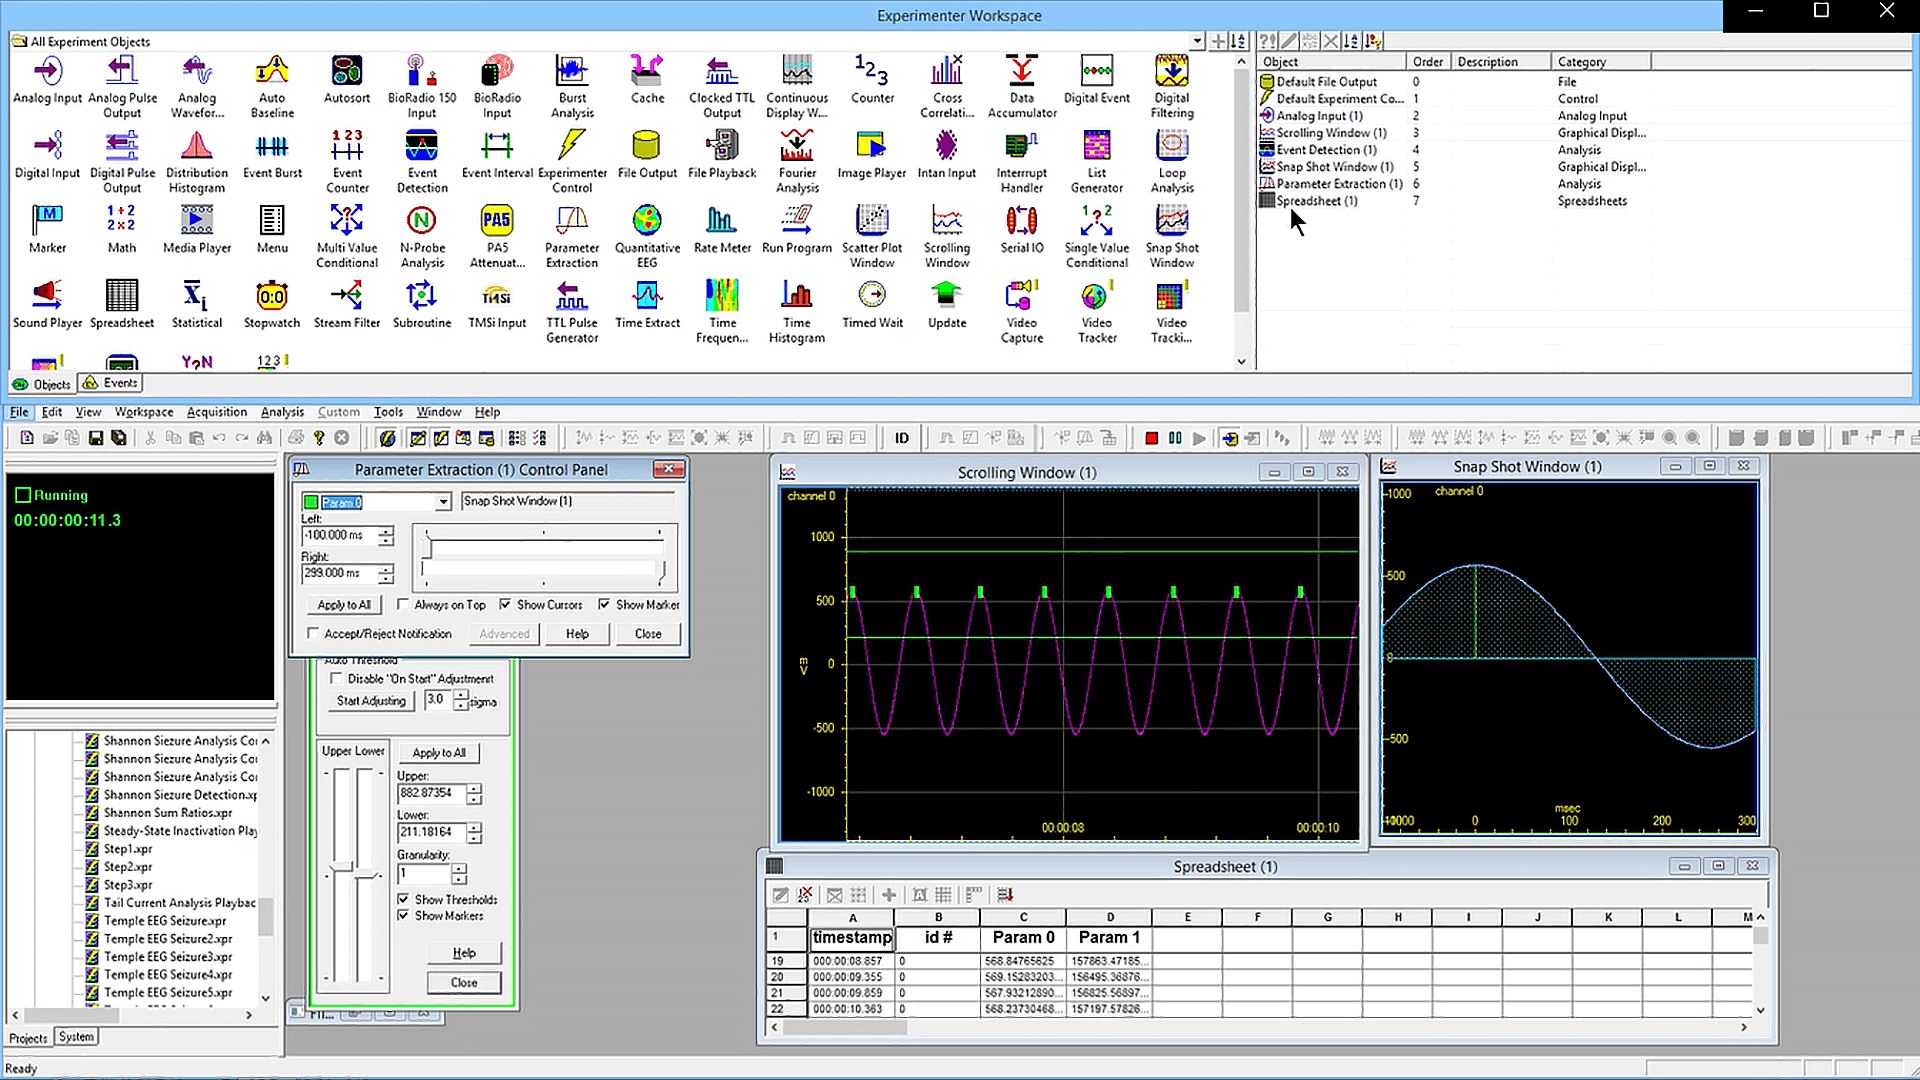
| Dynamically change experiment parameters during experiment |
|
|
|
|
|
| Conditional experiment execution based on real-time data analysis |
|
|
|
|
|
| Timers, counters and looping controls for automated experimentation |
|
|
|
|
|
| Read/Write to multiple digital ports for experiment control |
|
|
|
|
|
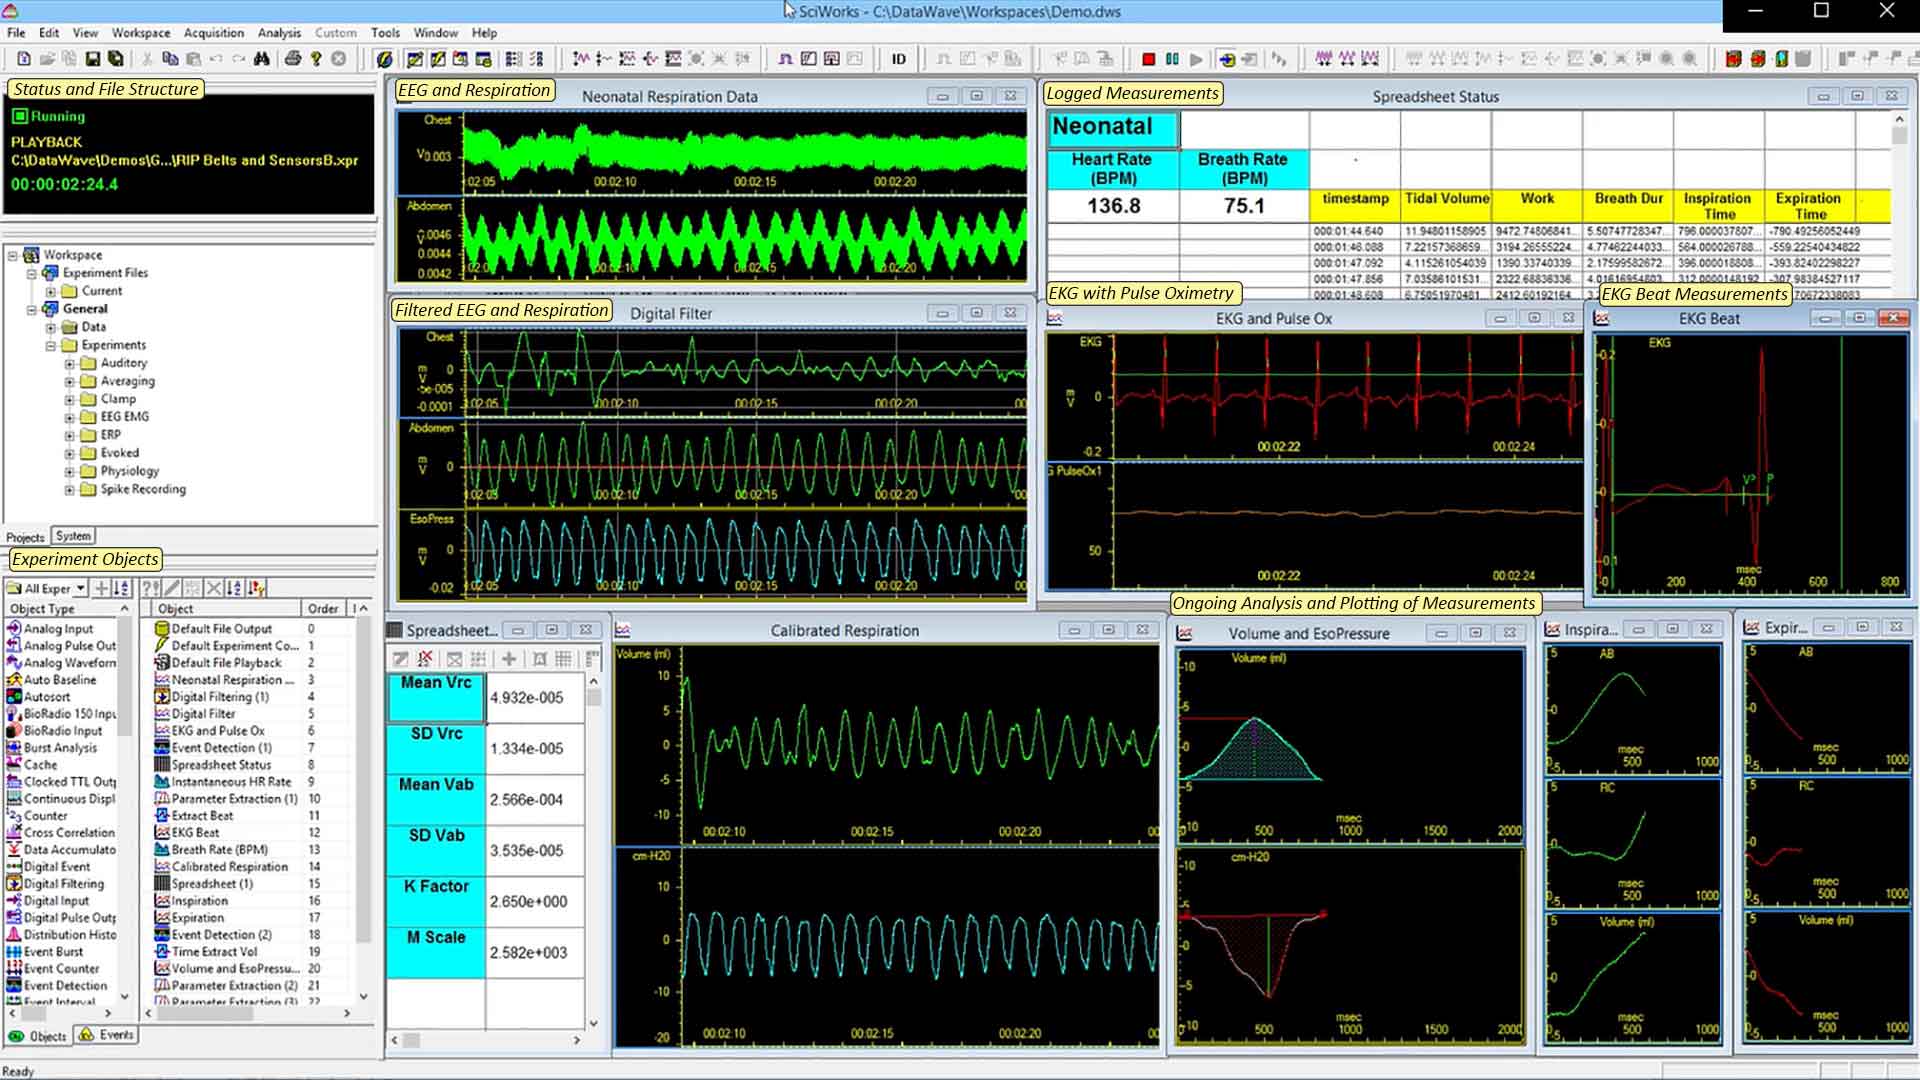
| Customizable windows to display acquired and analyzed data in real-time |
|
|
|
|
|
| Extensive file annotation ability |
|
|
|
|
|
| External triggering of data acquisition using TTL triggering or Digital IO |
|
|
|
|
|
| Experimental Design and User Interaction |
| Complex experimental protocols |
|
|
|
|
|
| Design your own menus and dialogs to use during real-time and file playback |
|
|
|
|
|
| Design status warnings when settings are incomplete or incorrect |
|
|
|
|
|
| Real-time logging of experiment protocols and execution |
|
|
|
|
|
| Data Analysis |
| Online or offline analysis |
|
|
|
|
|
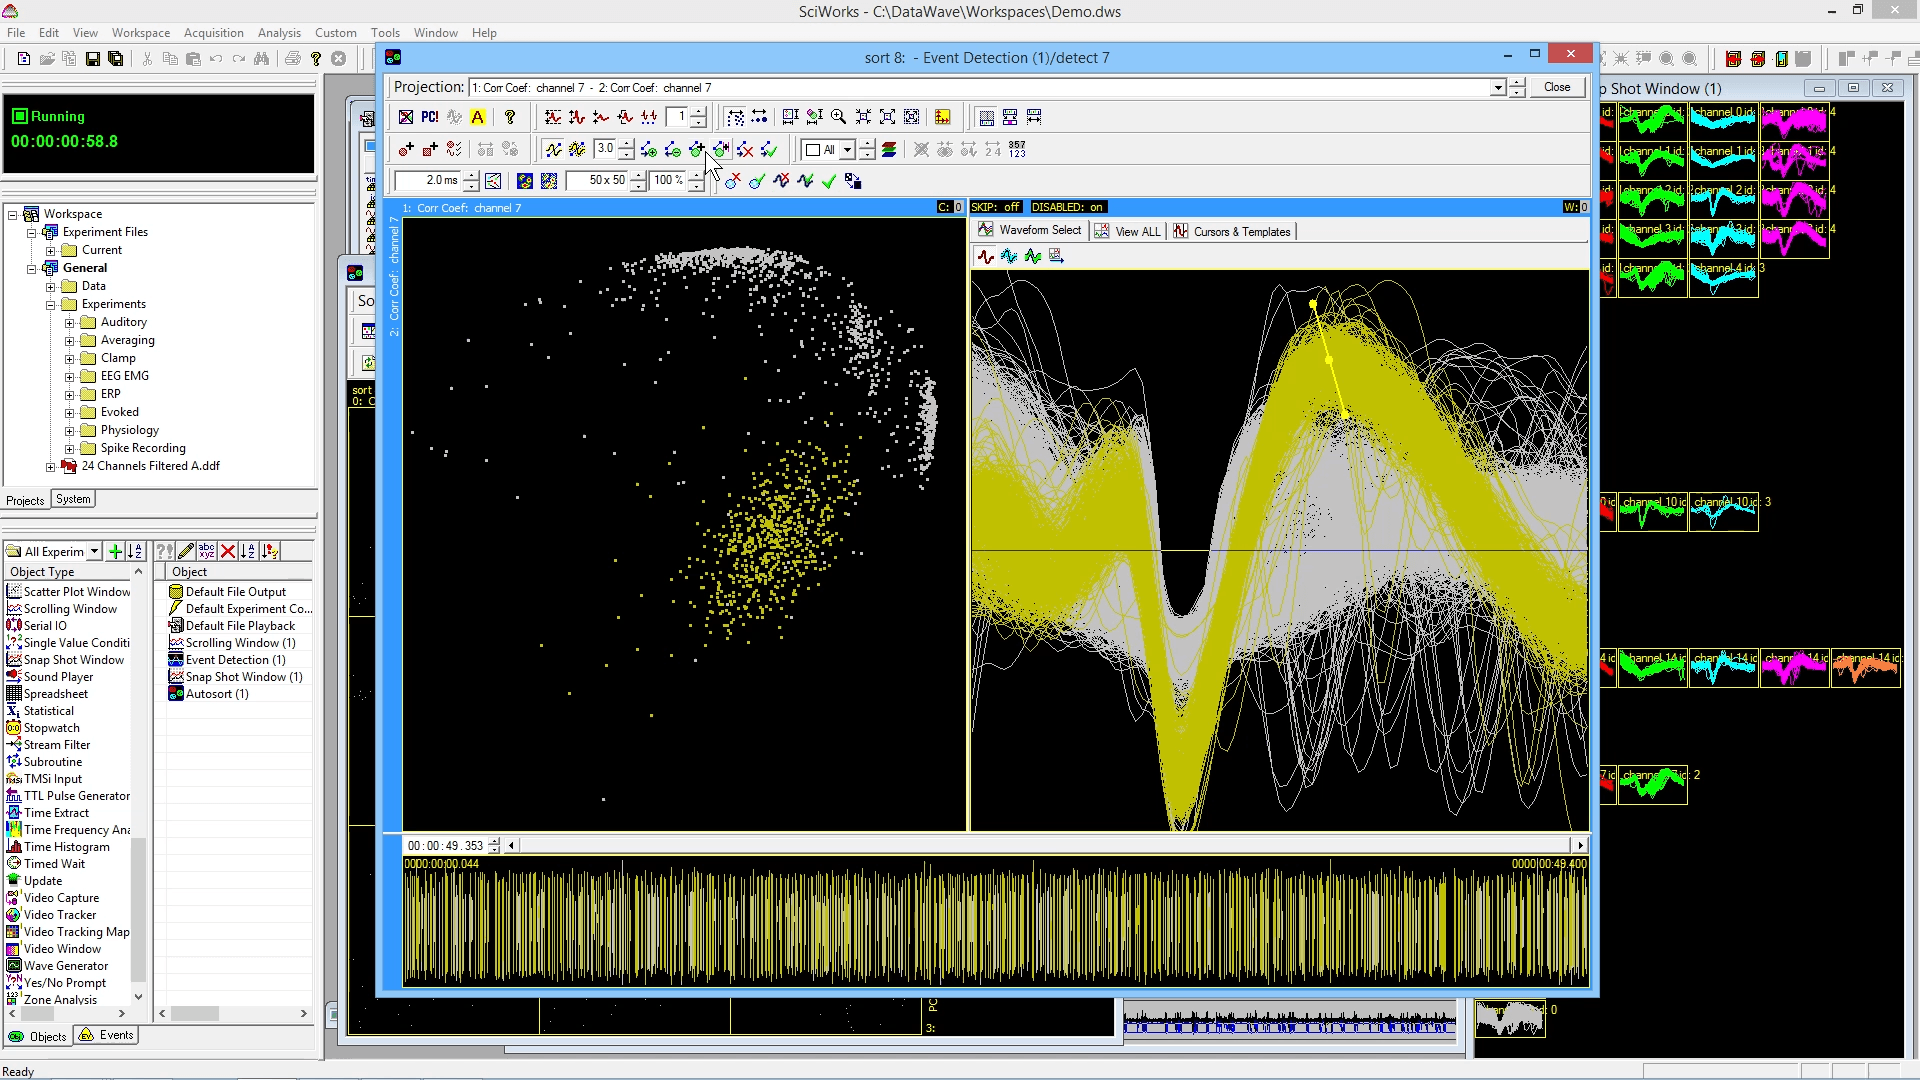
| Detect and extract events based on software window discriminators |
|
|
|
|
|
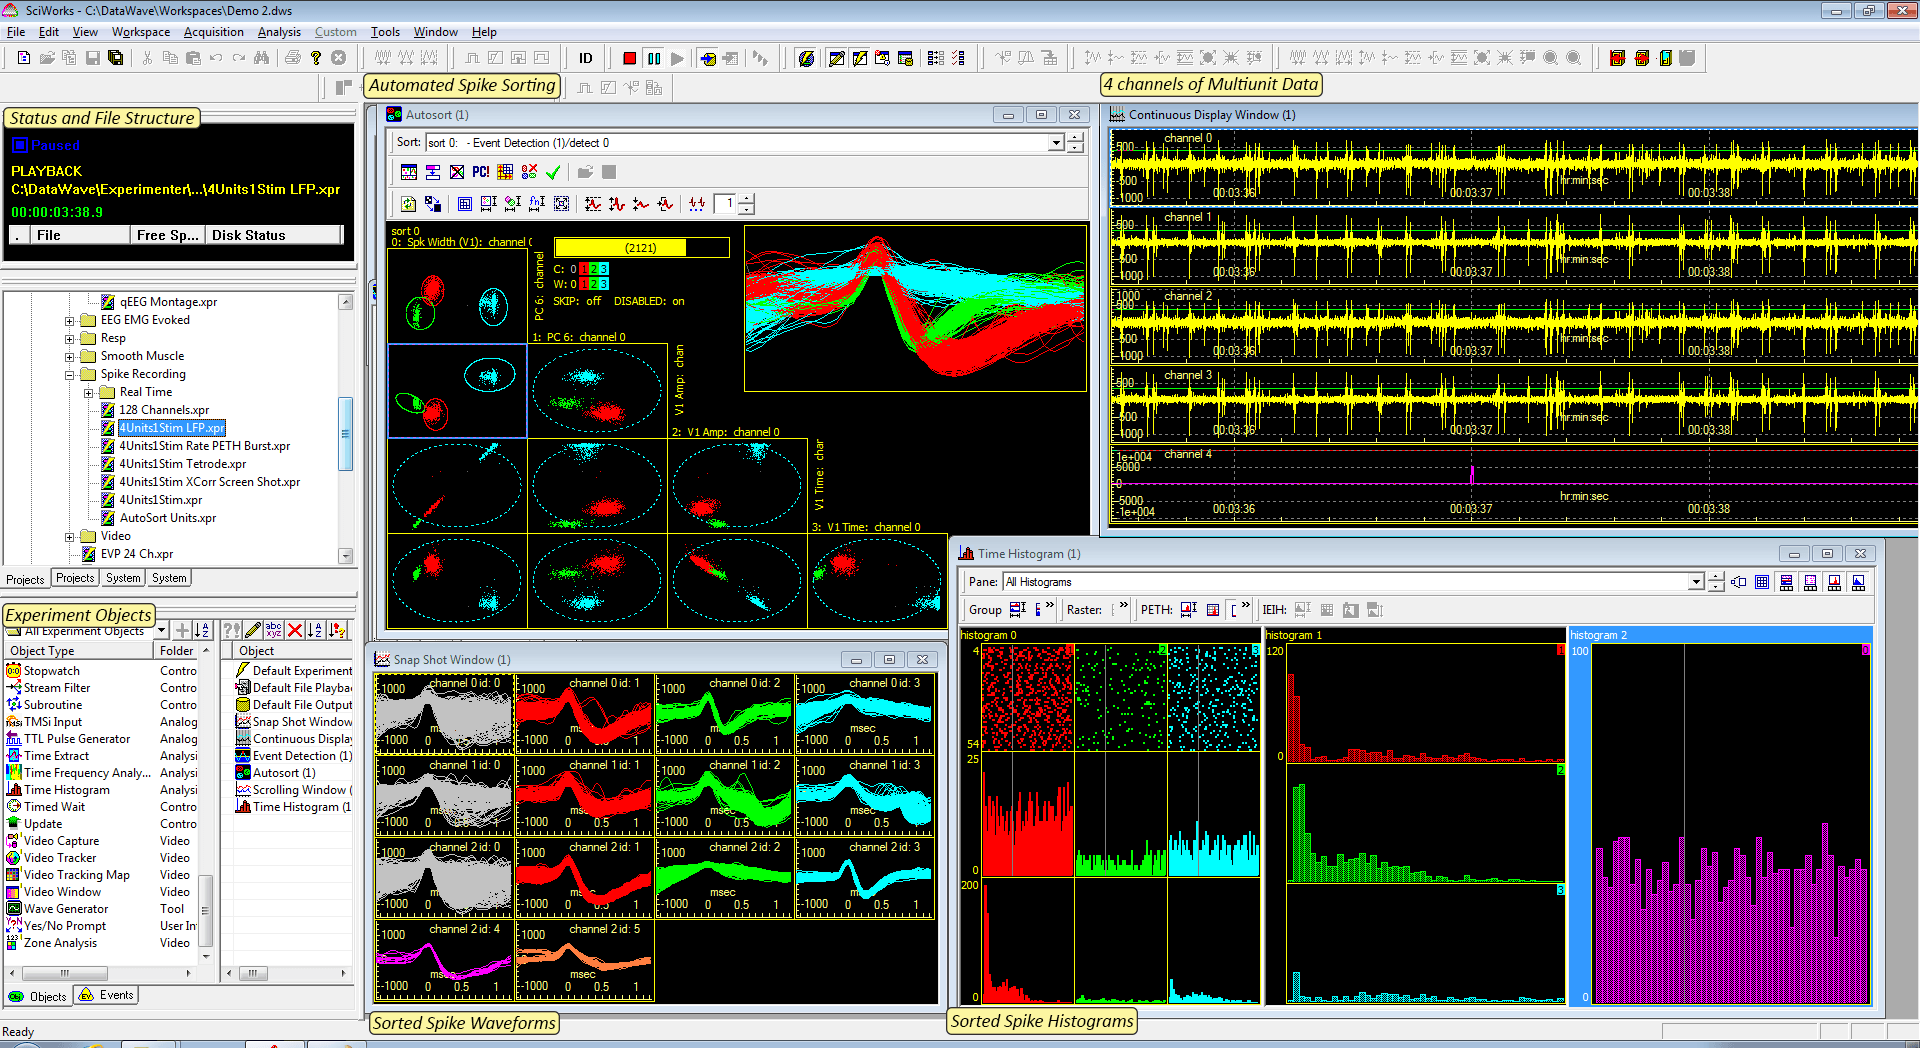
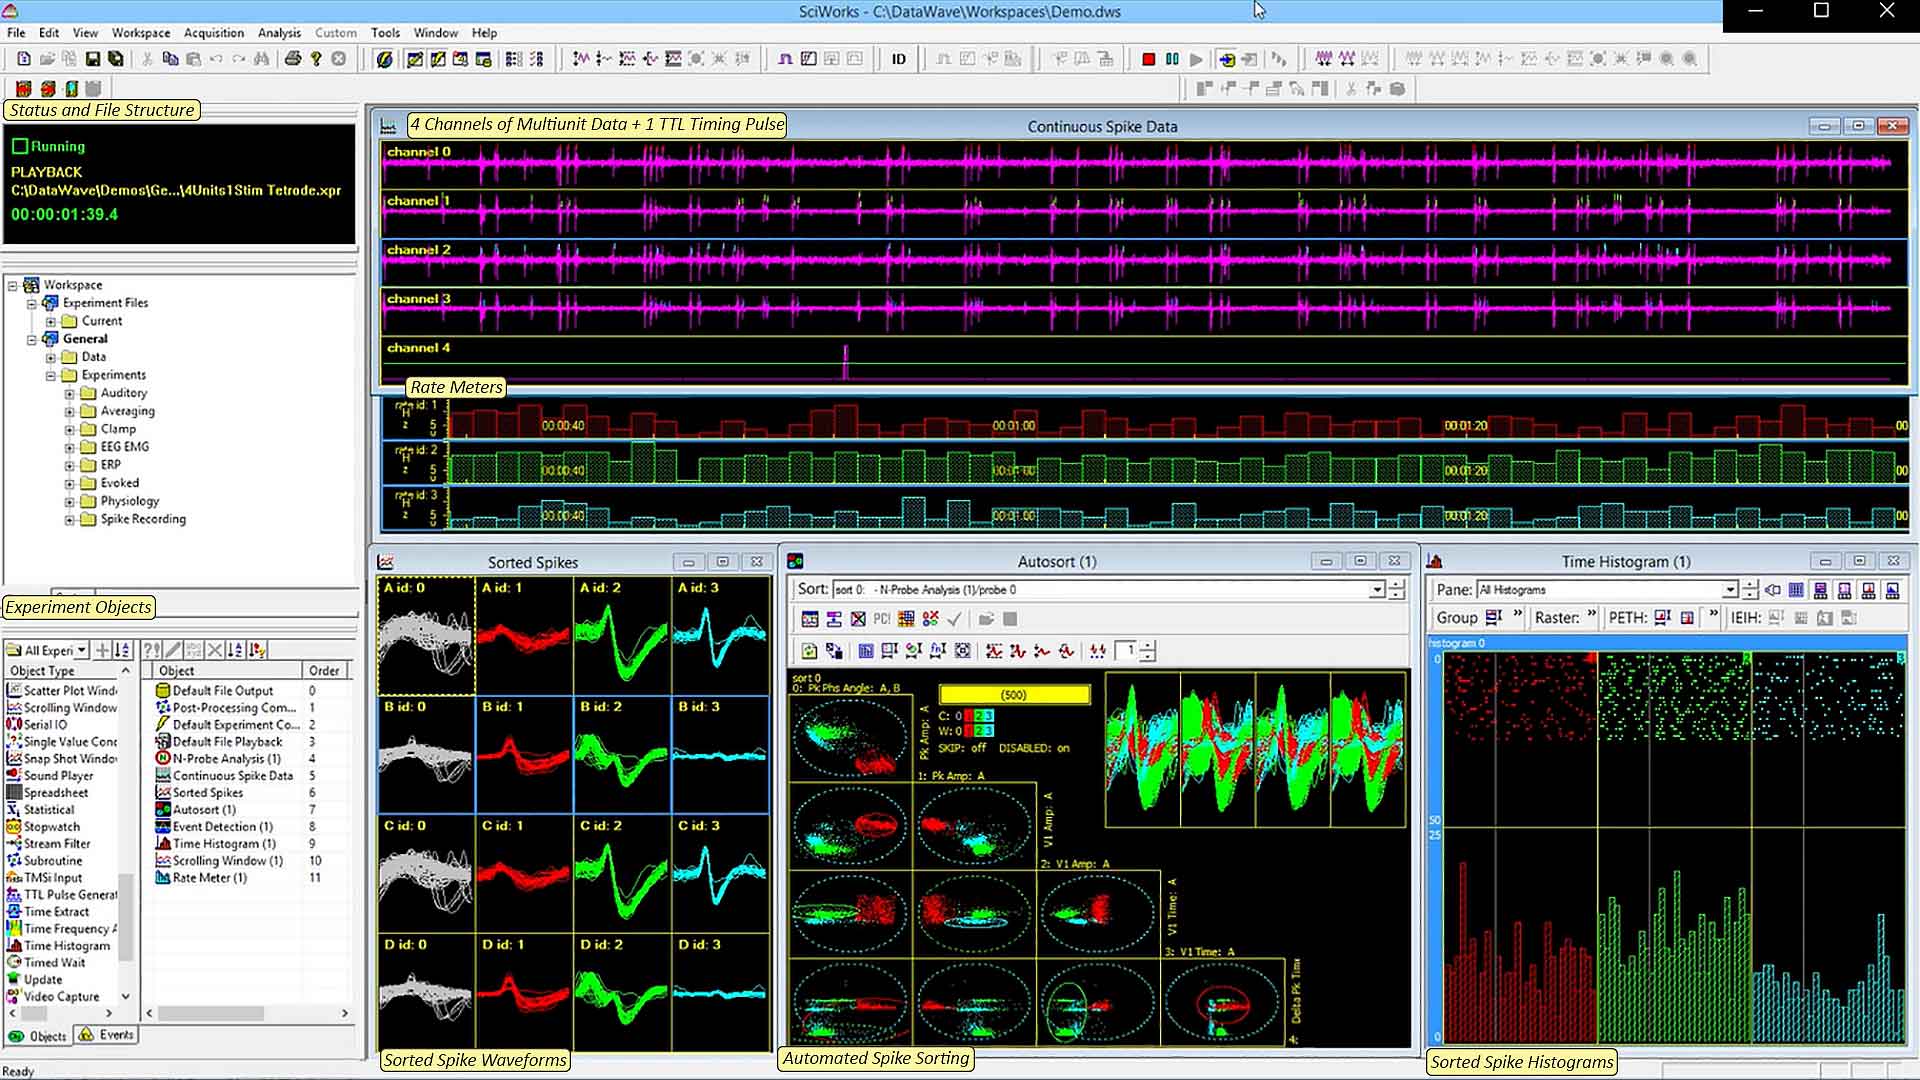
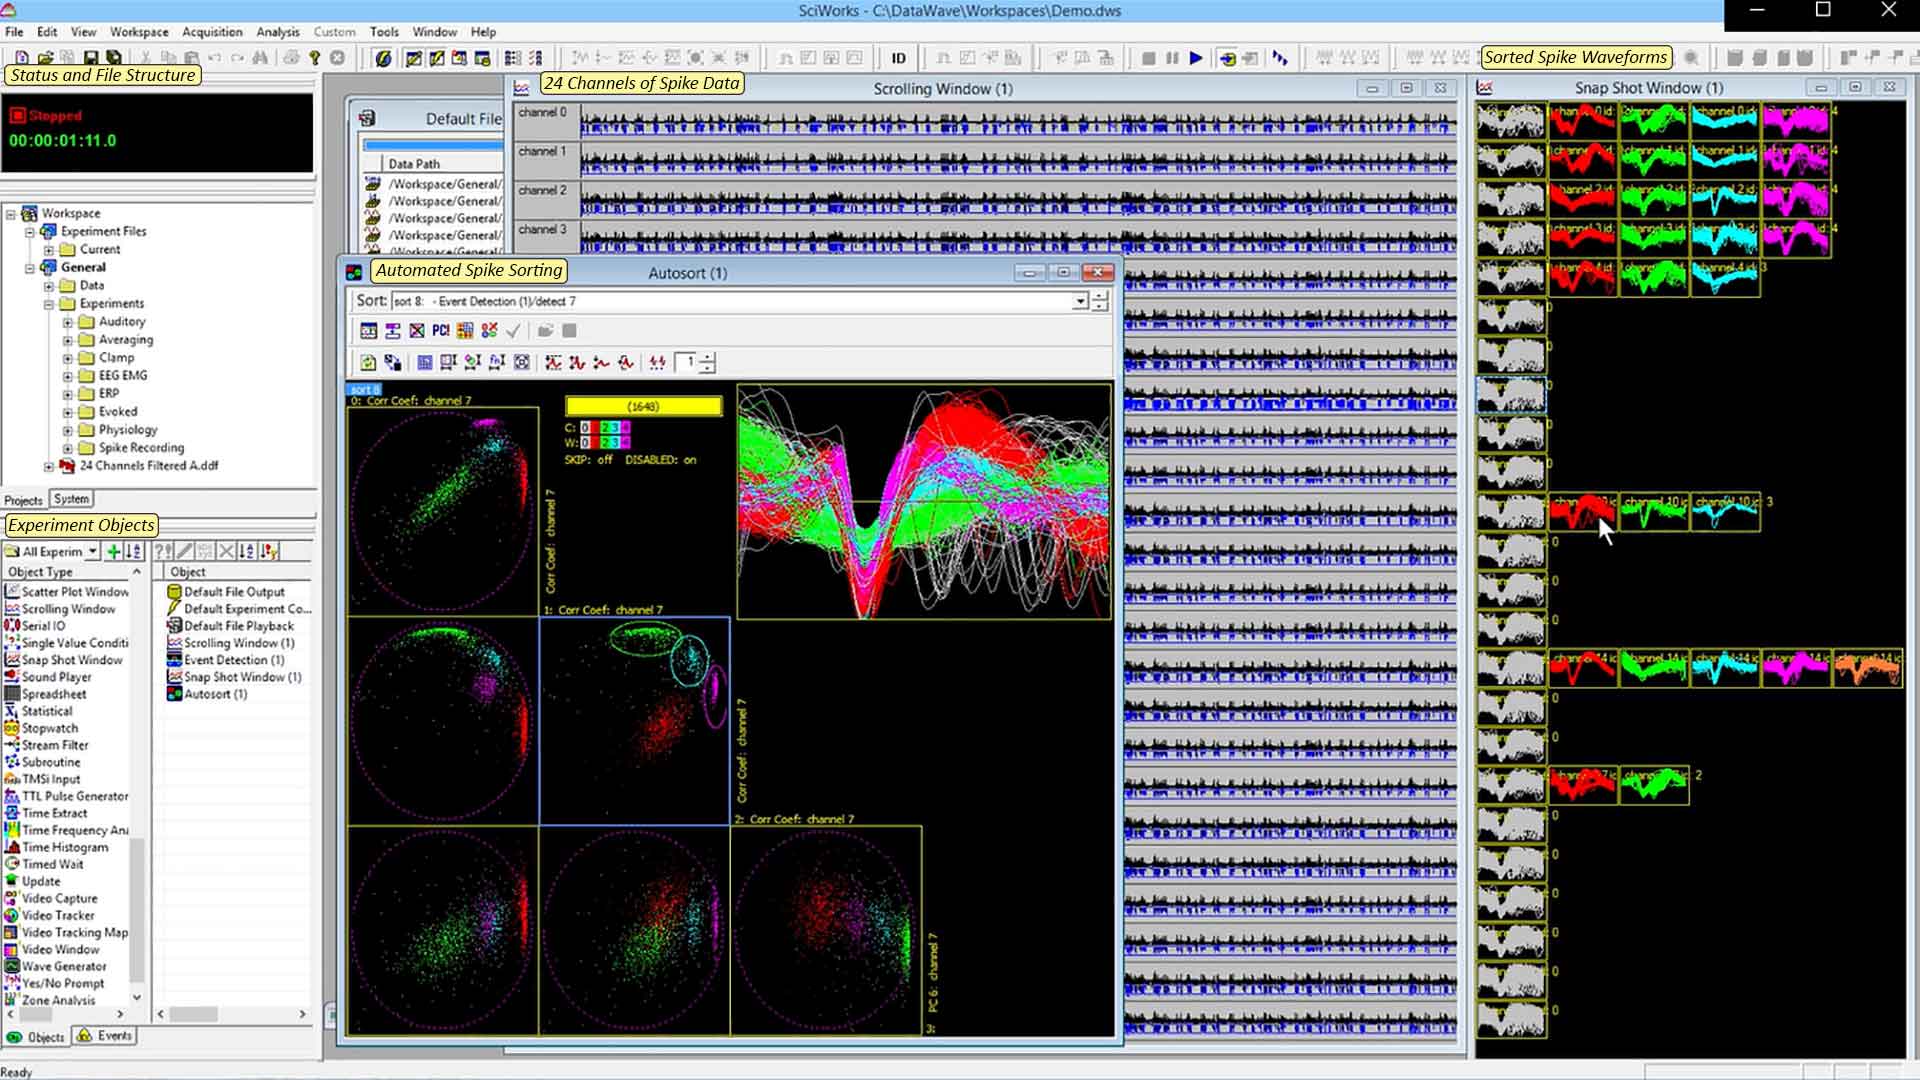
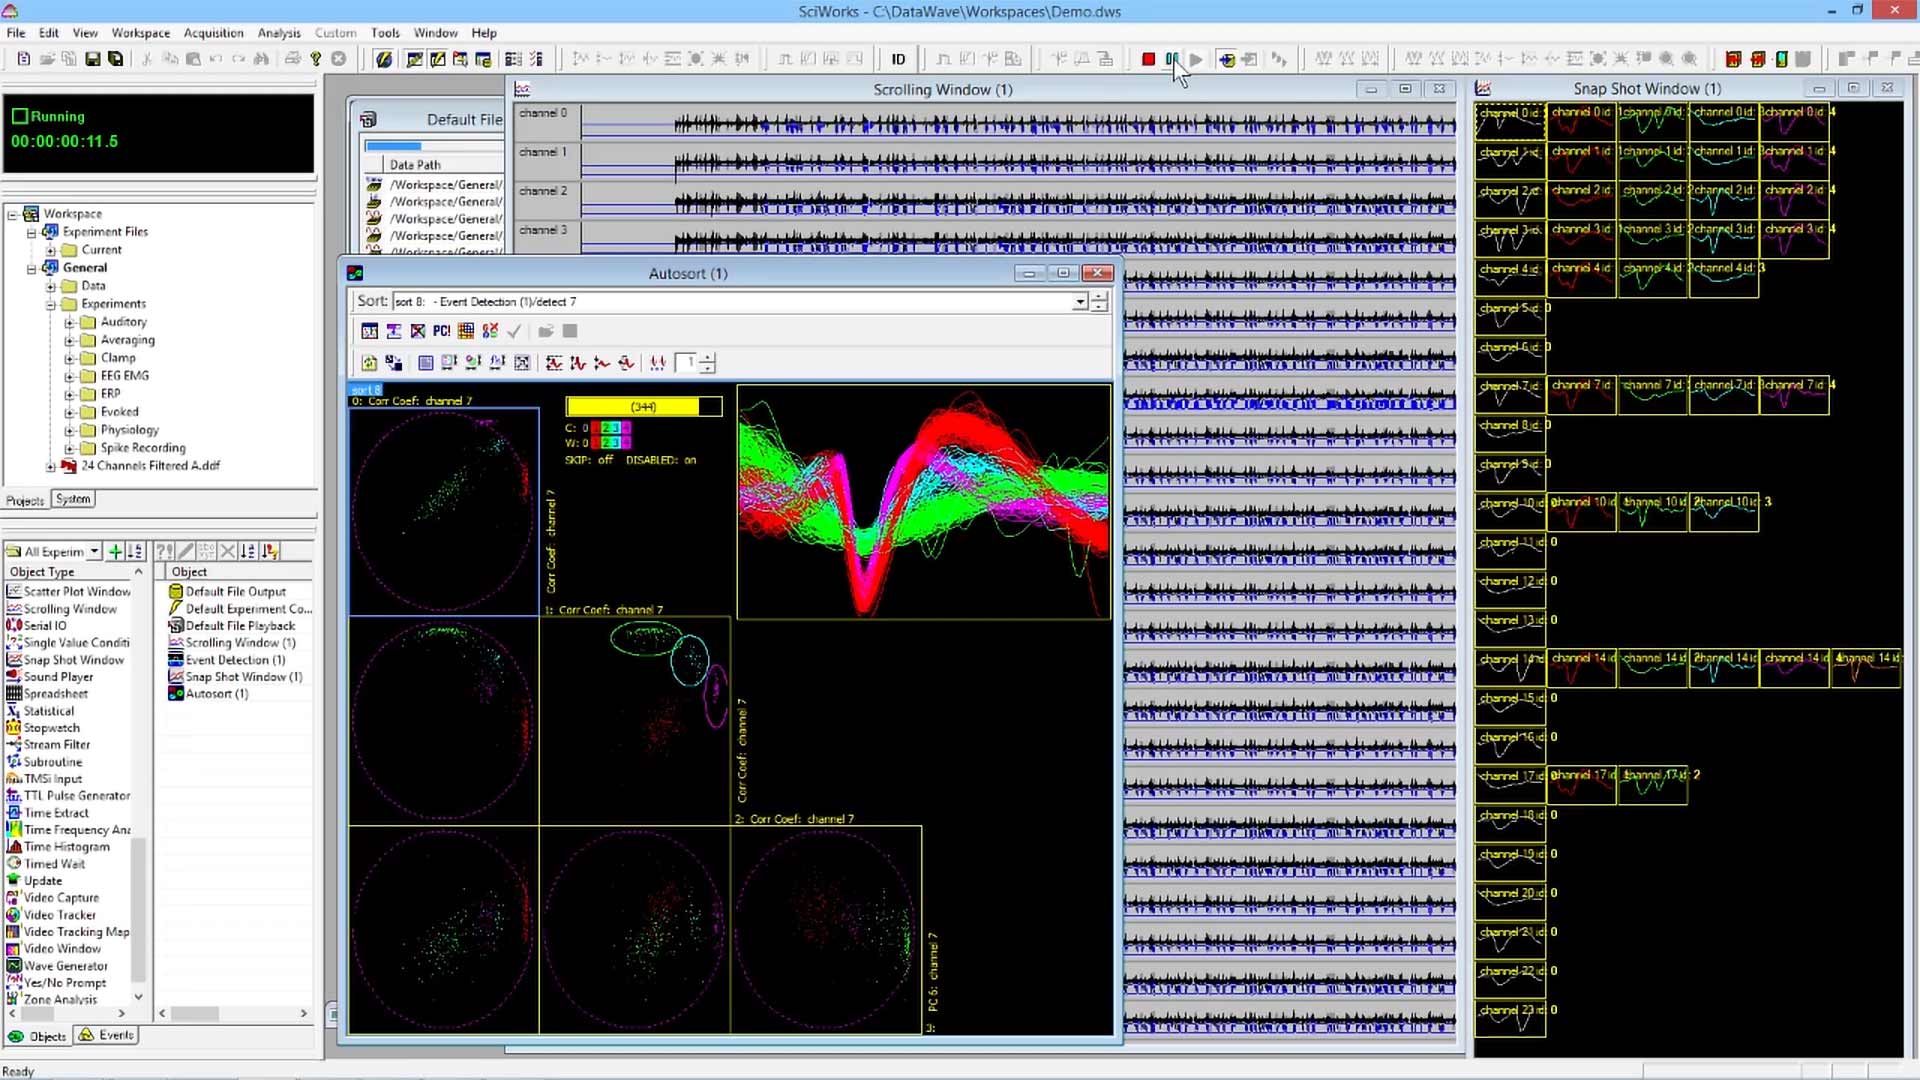
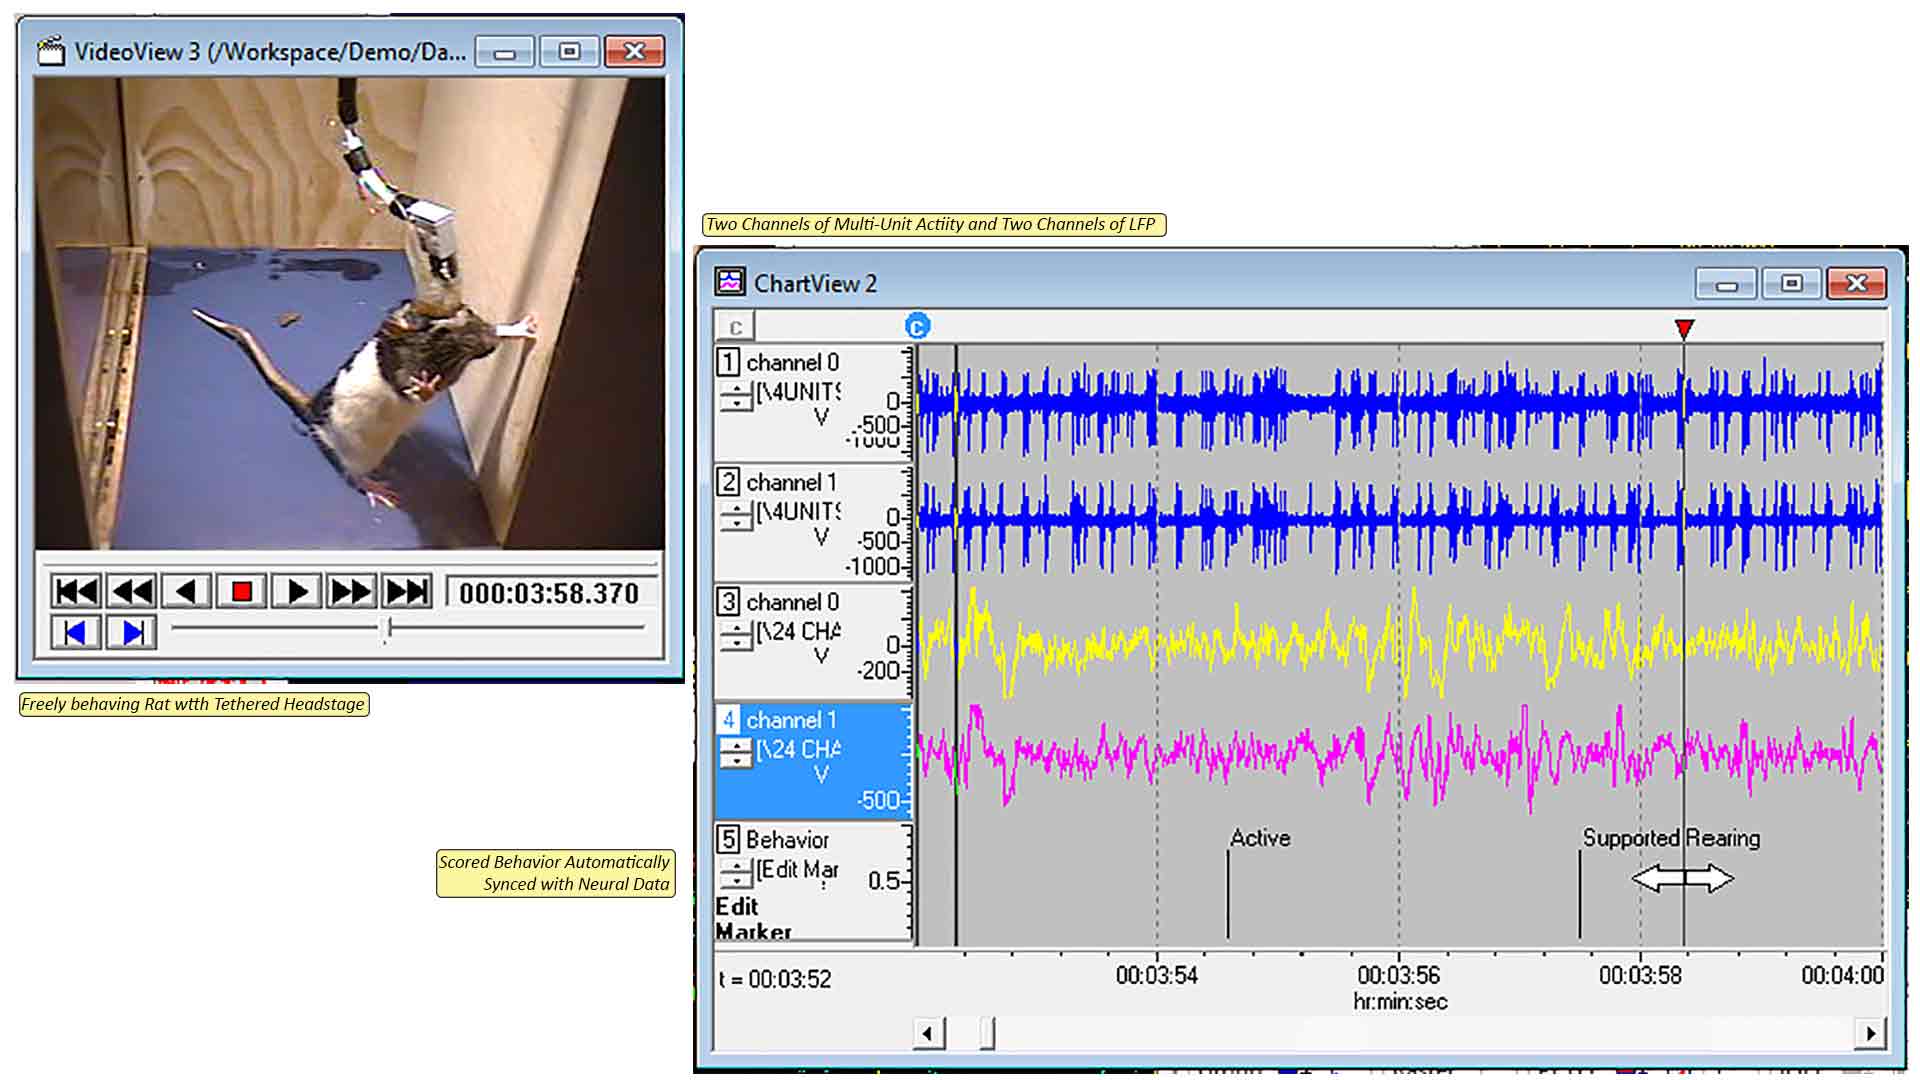
| Real-time Multi-Unit Spike Sorting & Separation |
|
|
|
|
|
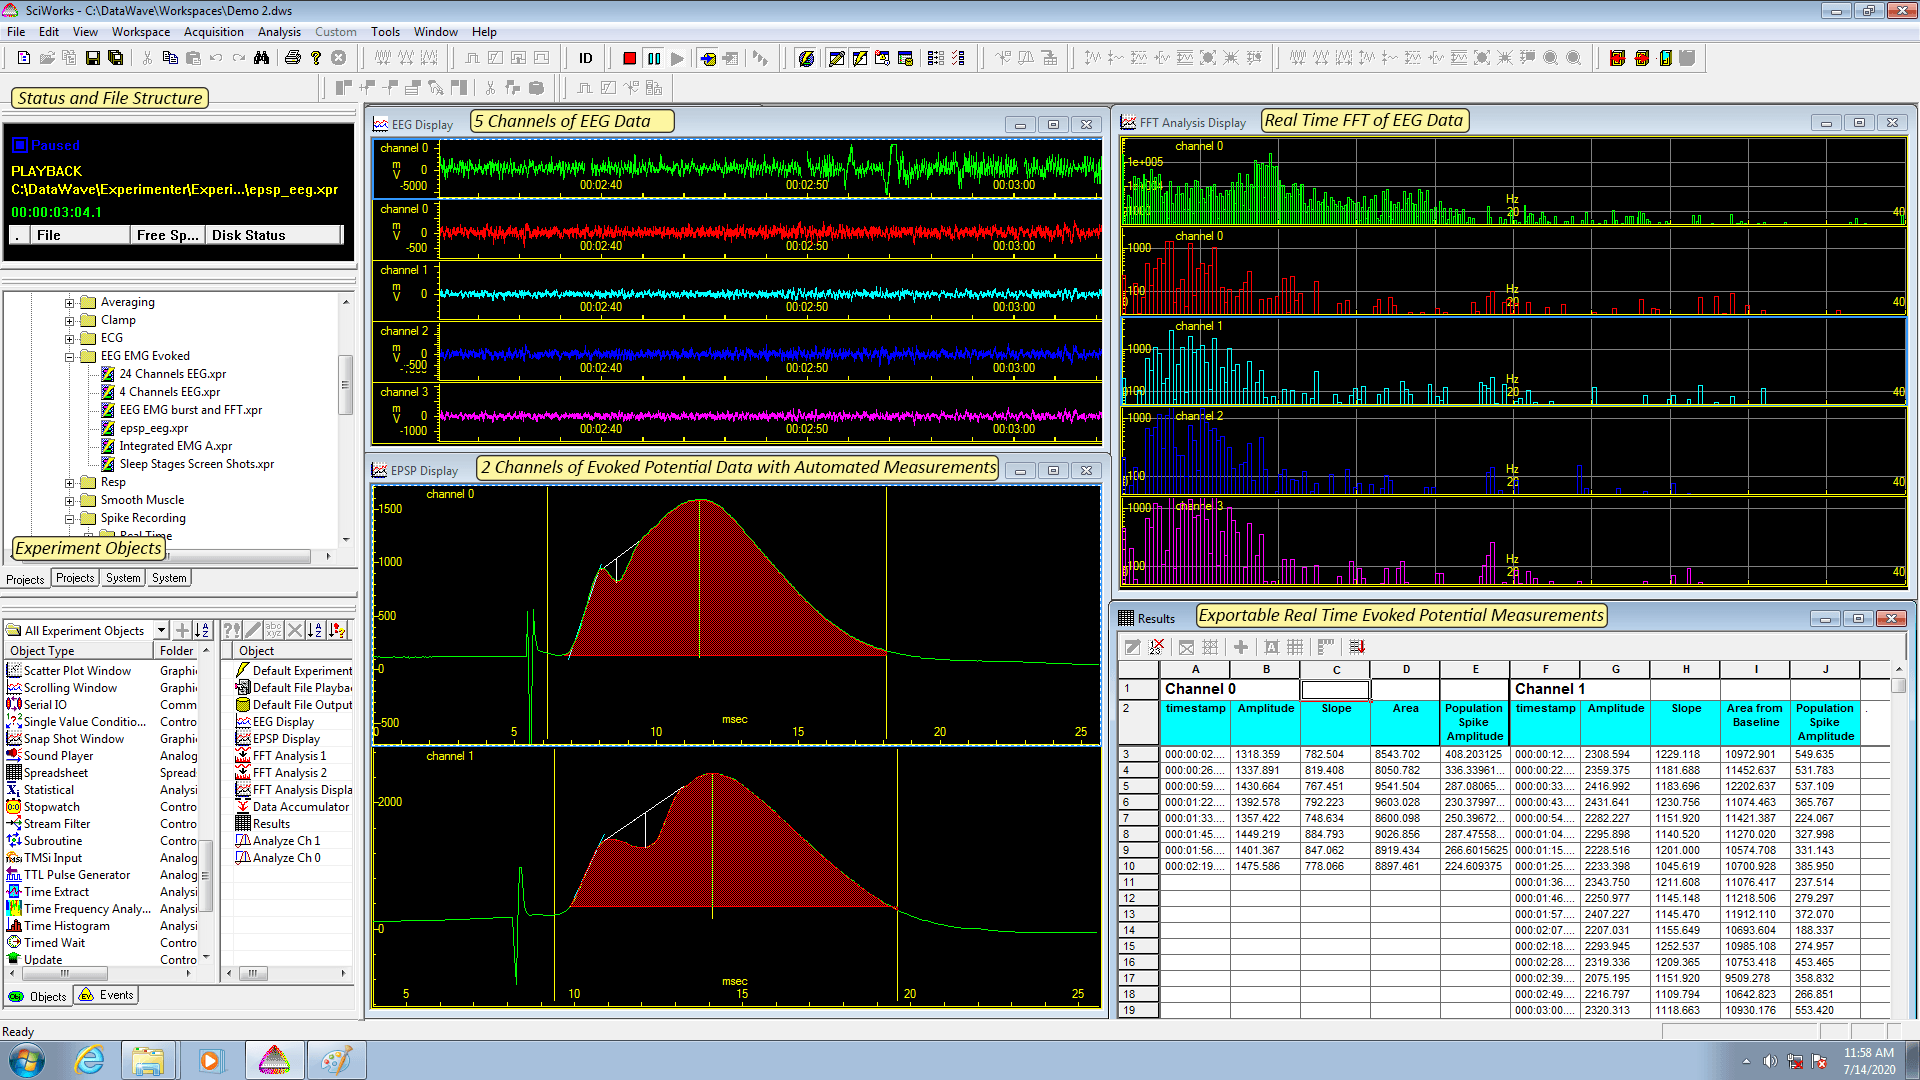
| Extract key waveform parameters such as peak, valley, area, and dV/dt |
|
|
|
|
|
| Waveform averaging |
|
|
|
|
|
| Event or spike triggered averaging |
|
|
|
|
|
| Digital filtering |
|
|
|
|
|
| Detect waveform bursts |
|
|
|
|
|
| Detect spike/event bursts |
|
|
|
|
|
| Rate meters and rate gauges |
|
|
|
|
|
| Firing rate grids |
|
|
|
|
|
| Perievent time (PETH), Inter-event interval (IEIH) histograms and Dot Rasters |
|
|
|
|
|
| Cross Correlation Histograms |
|
|
|
|
|
| Continuous Event interval analysis |
|
|
|
|
|
| Signal conditioning such as auto-baseline and waveform smoothing |
|
|
|
|
|
| Statistical calculations for waveform and single value data |
|
|
|
|
|
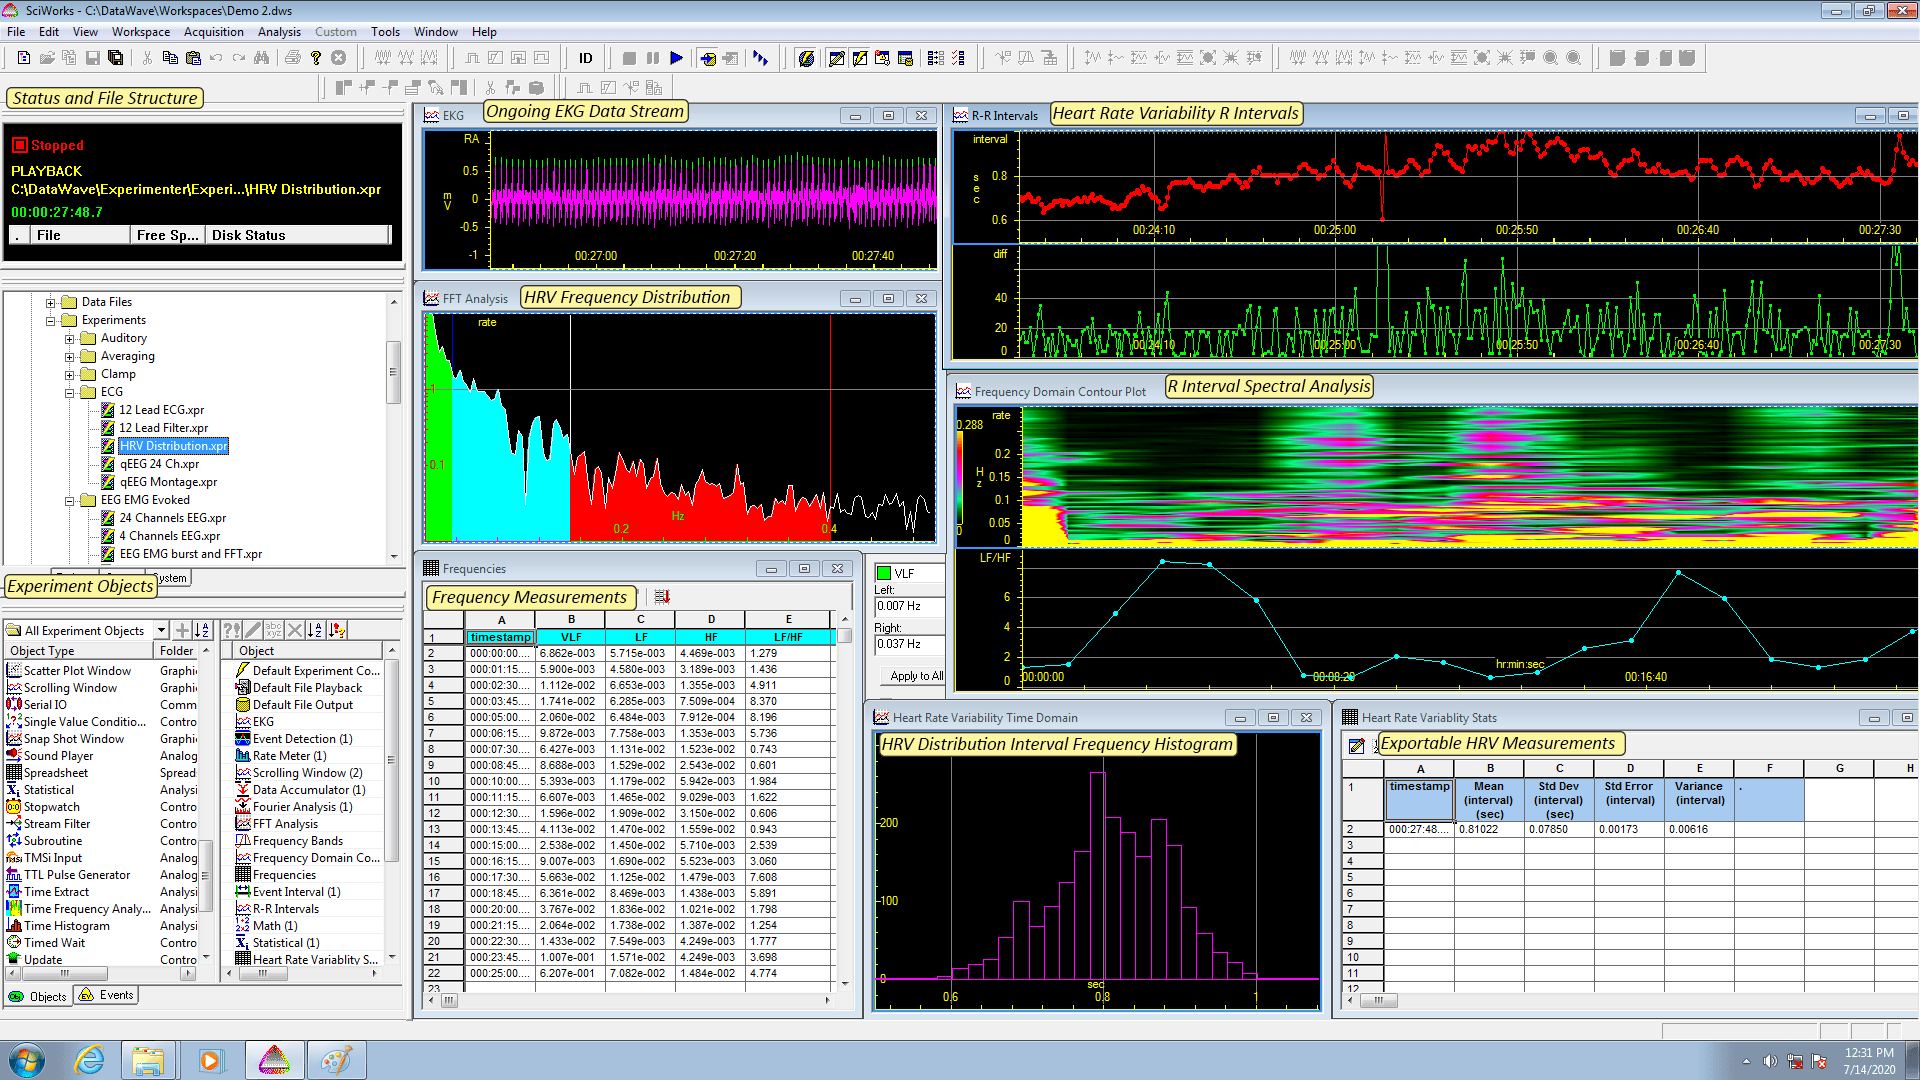
| Fourier Analysis including various power calculations |
|
|
|
|
|
| Sonograms and spectrograms |
|
|
|
|
|
| Statistical distribution analysis and display |
|
|
|
|
|
| Acquire to a real time spreadsheet for custom analysis and reporting |
|
|
|
|
|
| Analysis for tetrodes, stereotrodes and multi-array electrodes |
|
|
|
|
|
| Perform math operations defined by custom equations |
|
|
|
|
|
| Curve fitting of single values |
|
|
|
|
|
| Quantitative EEG for Skull Cap Multiple Electrode Analysis |
|
|
|
|
|
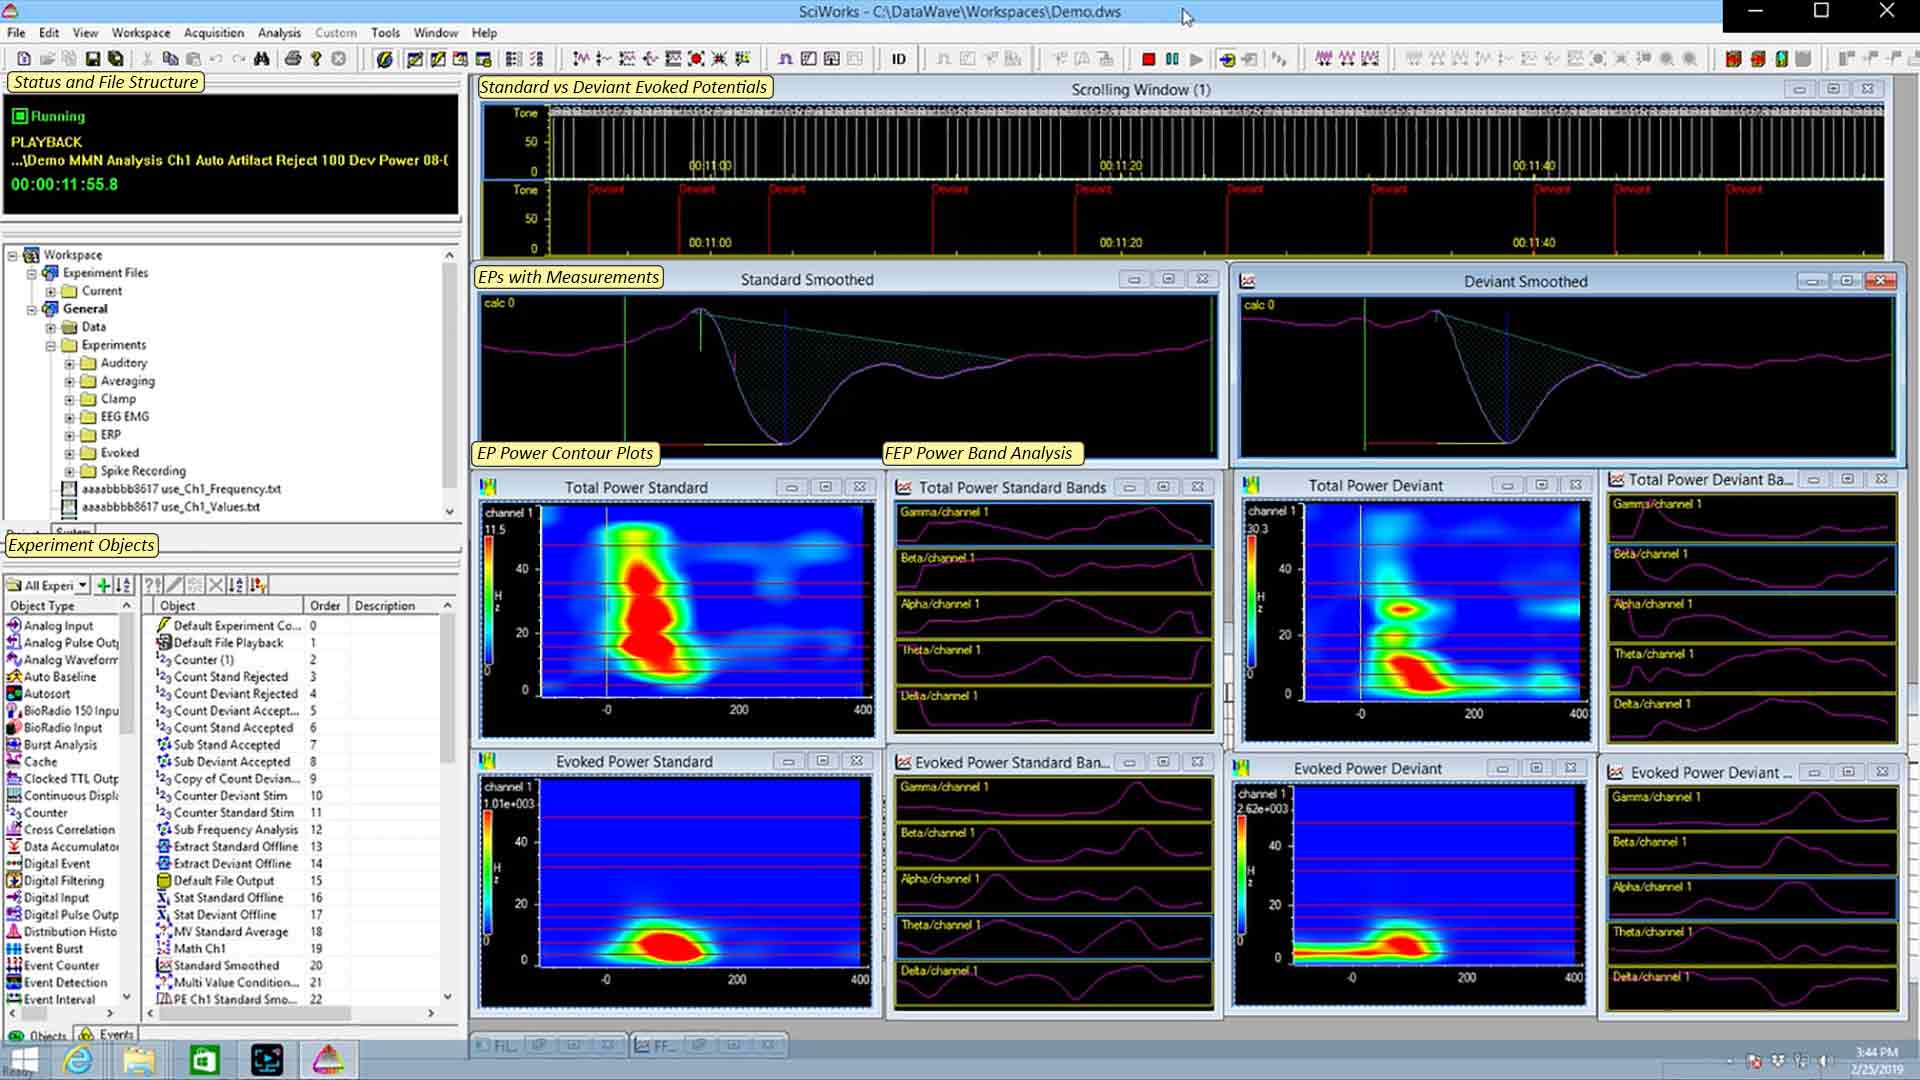
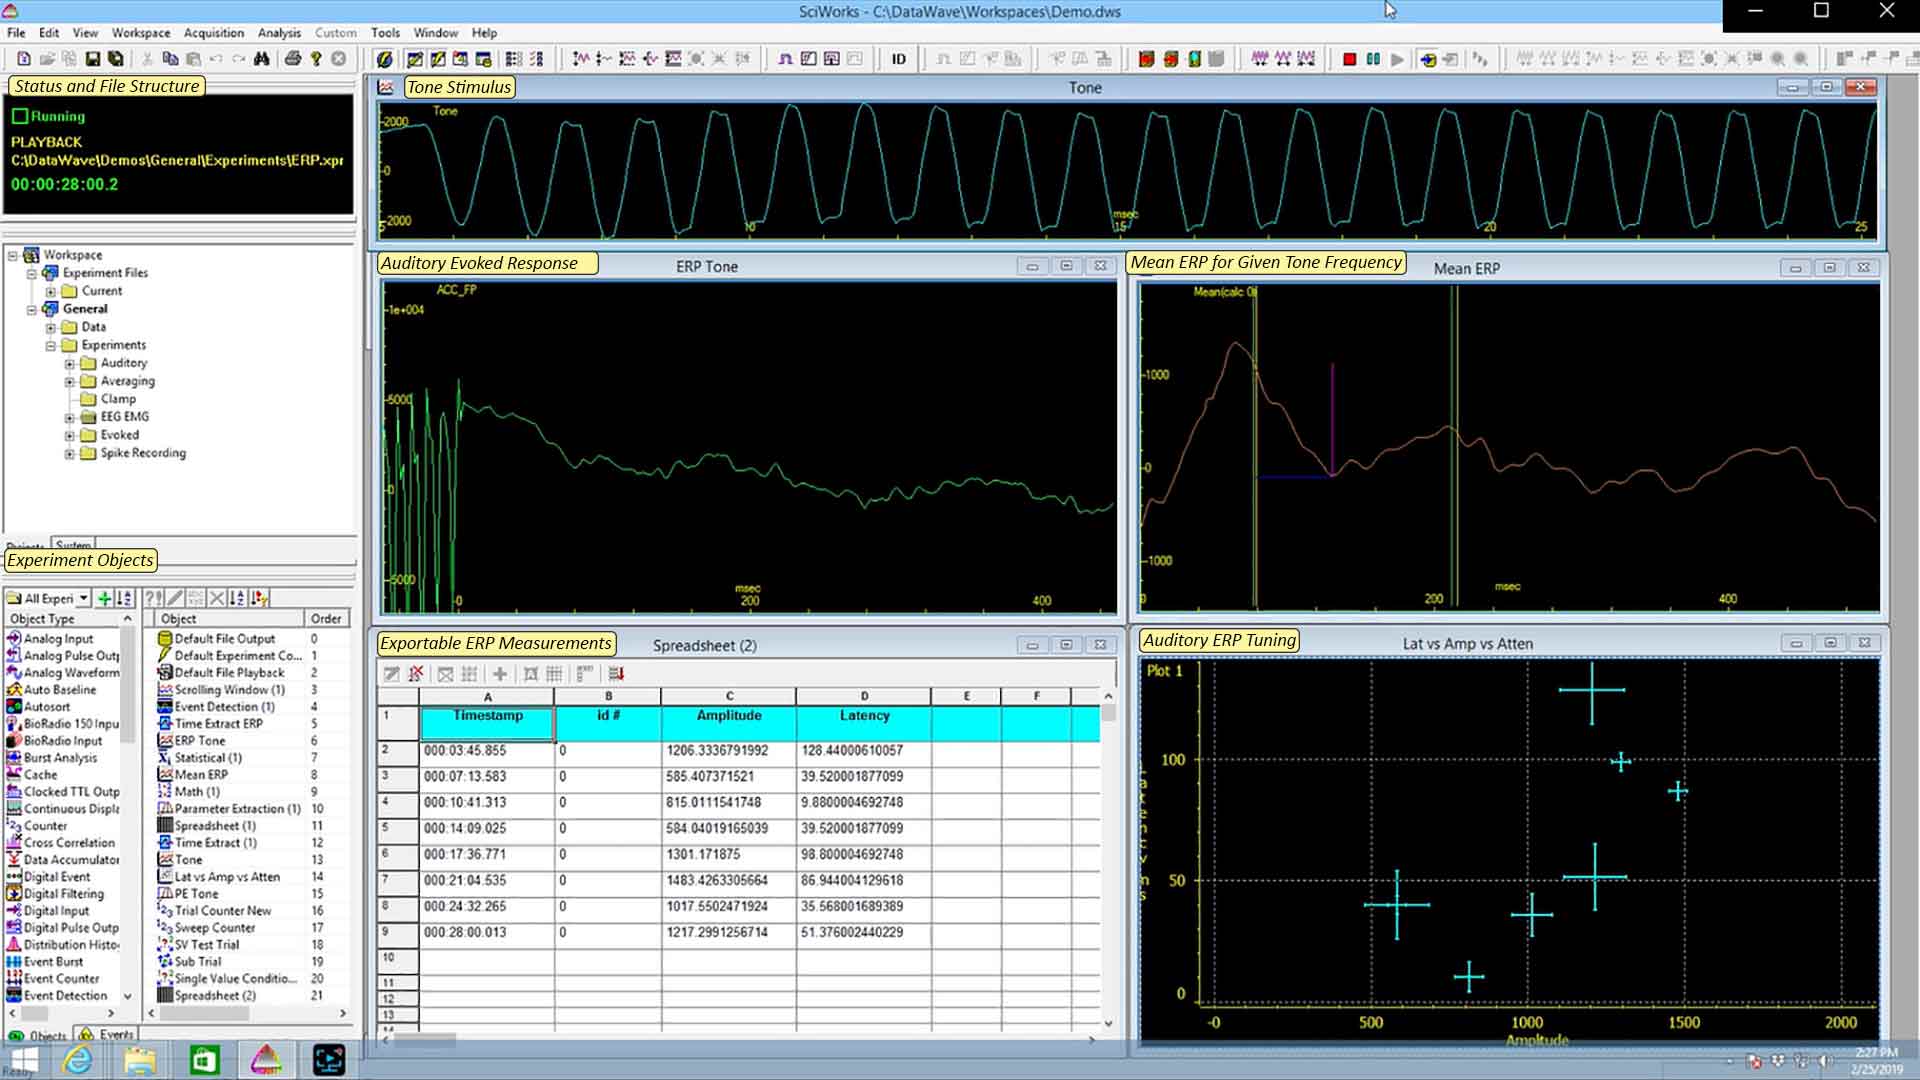
| High Resolution Time Frequency Analysis - for AEPs and seizure analysis |
|
|
|
|
|
| Loop Analysis - Analyzes respiration and cardiovascular data |
|
|
|
|
|
| File Output and Data Replay |
| Write to or read from files simultaneously during experimentation |
|
|
|
|
|
| Multiple data types (raw, analyzed and markers) can be saved to same file |
|
|
|
|
|
| Multiple formats supported for both import and export (i.e. DDF, WorkBench, Discovery, ABF, CED, Neuralynx, Plexon, EDF, NEV, Neuroshare, and ASCII) |
|
|
|
|
|
| Variable data playback speed |
|
|
|
|
|
| Drag & Drop, Copy & Paste files or selected data for replay and analysis |
|
|
|
|
|
| Video Functionality (VideoBench) |
| Supports a wide variety of Plug & Play digital video devices, including USB |
|
|
|
|
|
| Supports High Def (HD) |
|
|
|
|
|
| Remote camera control (zoom, pan, tilt) |
|
|
|
|
|
| View and capture video to file simultaneously |
|
|
|
|
|
| Unique frame-by-frame compression allows for hours of recording |
|
|
|
|
|
| Synchronized video to other data, including electrophysiological signals |
|
|
|
|
|
| Video timing is calibrated to experiment time with microsecond resolution |
|
|
|
|
|
| Capture continuously, in blocks of time, or as a snapshot |
|
|
|
|
|
| Scale images to actual size |
|
|
|
|
|
| Tracking (VideoBench) |
| Track one or more points simultaneously |
|
|
|
|
|
| Track bright, dark or colored spots |
|
|
|
|
|
| Tracked point smoothing |
|
|
|
|
|
| Calculate speed, distance, total distance, etc. |
|
|
|
|
|
| Track points to full frame or selectred regions within a frame |
|
|
|
|
|
| Define multiple tracking zones of any shape |
|
|
|
|
|
| Paired-point tracking for tracking orientation |
|
|
|
|
|
| Save tracked points to file along with other experimental data |
|
|
|
|
|
| Track points real-time or from an already existing video file |
|
|
|
|
|
| Output tracked points in scaled, pixel or grid format |
|
|
|
|
|
| Tracked point data is compatible with existing analysis applications |
|
|
|
|
|
| Video Analysis (VideoBench) |
| Display one or more video windows |
|
|
|
|
|
| Overlay tracked points and tracking maps with video |
|
|
|
|
|
| Dynamically size windows even during capture |
|
|
|
|
|
| Display grid, tracking grids and tracked regions |
|
|
|
|
|
| Display 3D tracking maps |
|
|
|
|
|
| Tracking Maps for calculating tracking information in a user defined grid |
|
|
|
|
|
| Zone Analysis for calculating tracking information in user defined zones |
|
|
|
|
|
| Graphically display Zone and Tracking Map results in a video window |
|
|
|
|
|
| Display Zone and Tracking Map results in a spreadsheet |
|
|
|
|
|
| Calculate tracking values (i.e. avg. speed, number of visits, time in zone, etc.) |
|
|
|
|
|
| Calculate values per zone (i.e. number of firings or events, avg. firing rate) |
|
|
|
|
|
| Calculate data values (i.e. EEG power values) verses tracking map location |
|
|
|
|
|
| Values can be calculated on a per zone visit or across all visits to a zone |
|
|
|
|
|
| Values can be calculated on a per trial or experiment basis |
|
|
|
|
|
| Values can be written to a spreadsheet, both real-time and post experiment |
|
|
|
|
|
| Video Replay and Editing (VideoBench) |
| Replay captured video real-time, fast-as-possible or frame-by-frame |
|
|
|
|
|
| Instantaneously access any point in time |
|
|
|
|
|
| Insert and edit marker or scoring information in conjunction with video |
|
|
|
|
|
| Cut, copy and paste video data into an existing or new file |
|
|
|
|
|
| Image printing capabilities |
|
|
|
|
|